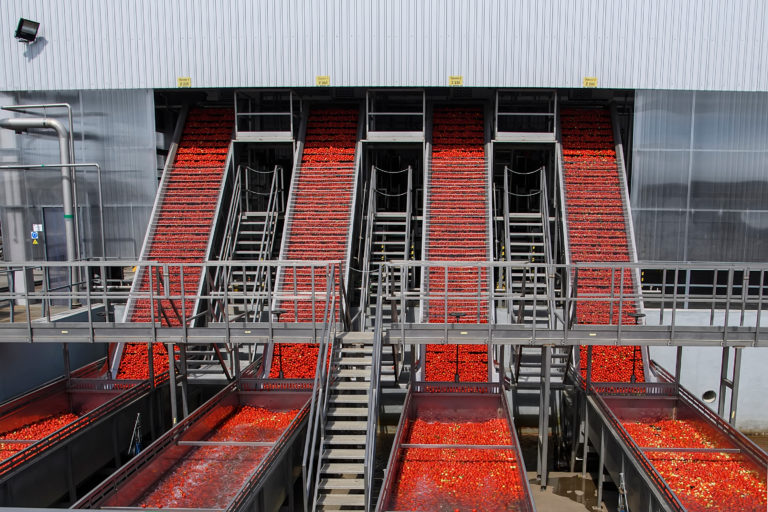
Corn is as American as apple pie. Native Americans first introduced it to the Pilgrims to help them through the winter months. In addition to using corn as feed for livestock, settlers soon began cultivating the grain into grits, cornbread, and bourbon.
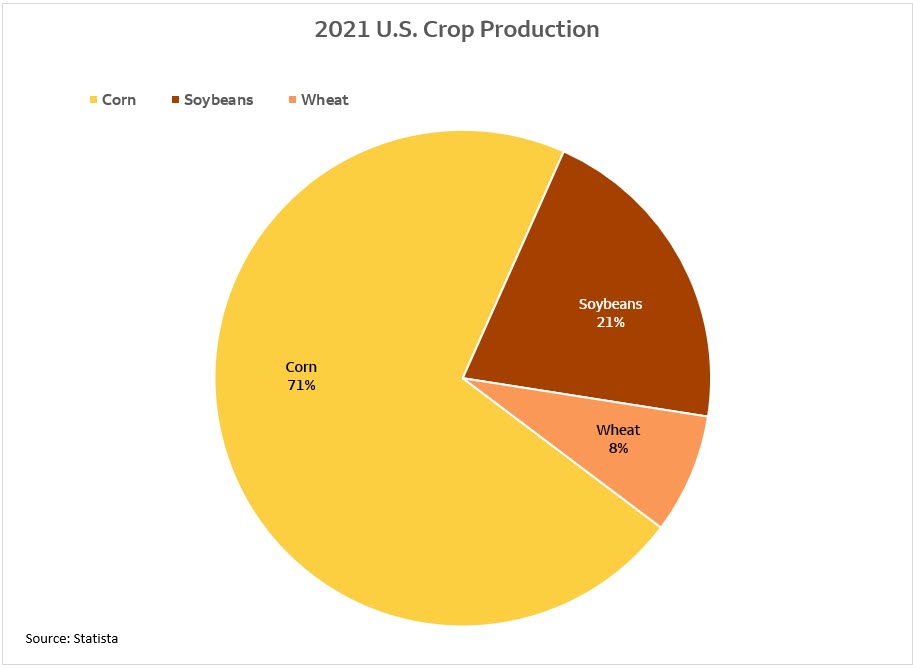
As illustrated in the chart below, corn continues to be the major crop in the U.S.1 and serves as a driver of all agriculture. It is one of the leading feedstocks for dairies, feedlots, swine, and poultry, as well as being a key component of ethanol. Furthermore, corn has numerous uses in consumer products such as cornmeal and corn starch, food ingredients on their own, and corn starch is also used to produce high fructose corn syrup which can be found in a wide array of foods and beverages.
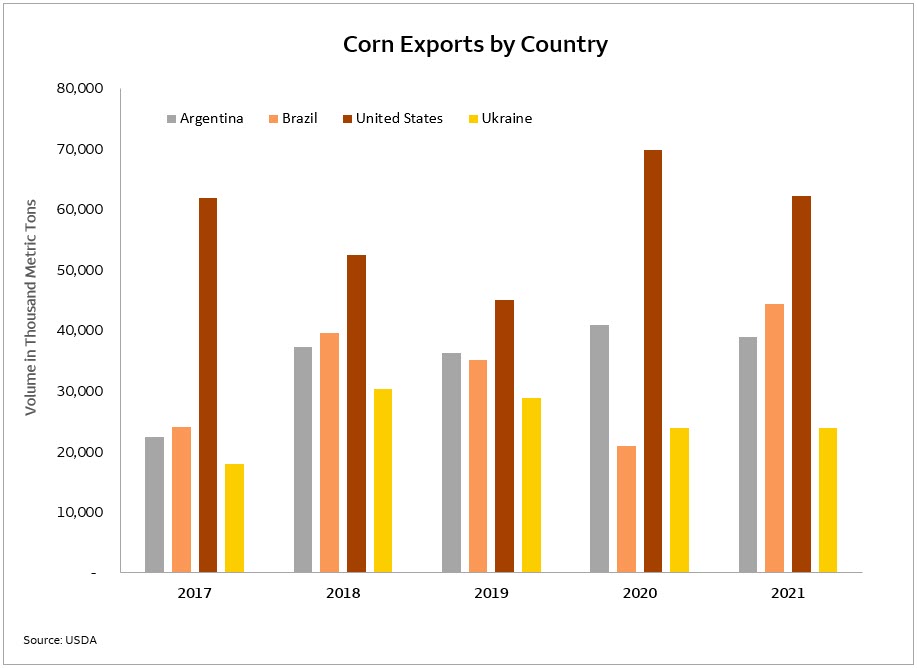
America has been the significant provider of corn for more than 200 years and easily remains the world’s largest producer of the grain.2 Other significant corn exporters include Argentina, Brazil, and Ukraine2 since these countries all have soil types and precipitation conducive to raising corn. But, America holds the advantage of vast corn acres which provide food, feed, and fuel for the world.
It can be argued that America’s wealth and resources are attributed to corn and agriculture in general. Of course, there are other key U.S. industries that create substantial cash flow. However, if you think about, with the Mining and Oil Production industries, the amount of future wealth is reduced from these resources upon extraction. And, in the Manufacturing industry, factories assemble, modify, or add value, but a new resource is not created in the process. On the opposite side of the spectrum, the Agriculture industry creates new wealth as new crops and livestock appear each year, thus agriculture is the ultimate renewable resource. Hence, countries with strong agriculture generally become strong and wealthy countries.
Corn leads the grain sector
We have discussed the history and significance of corn, but why is this starchy vegetable the leading grain in the sector?
Corn, soybeans, and wheat are the primary grains of significance in the U.S. Historically, the U.S. had been the breadbasket of the world for its wheat source, however, wheat can be grown in nearly every country nowadays. It has more recently proliferated throughout the world, and the U.S. is now planting the fewest acres dating back to the early 1900s.3 The U.S. currently produces enough wheat for its own milling industries, with a smaller volume sold into the export marketplace.
Similarly, the U.S. has recently been replaced as the world’s leading soybean producer by South America. Soybeans, a legume with nitrogen fixing nodules that put nitrogen into the soil, remain a critical crop that is rotated with corn. The year after a soybean harvest, a corn crop is planted, and the nitrogen rich soil serves as a nutrient for the corn plant. This rotation concept helps reduce the amount of fertilizer needed as opposed to the large amount needed when corn is planted on the same land year after year. However, it is important to note that an acre of land will produce, on average 50 bushels of soybeans, but that same acre will produce 180 bushels of corn.4 Thus, corn is the king of crops in the U.S.
We have established that corn serves as the catalyst for agriculture and helps drive the U.S. economy. So, let’s further breakdown where it is raised and how it is utilized.
Geographically, the corn belt states stretch from Ohio through Nebraska. The ‘I’ states of Indiana, Illinois, and Iowa are referred to as the heart of corn country. However, new short-season seed varieties are now moving the northern corn belt boundary up to Canada as Minnesota, Wisconsin, and the Dakotas produce corn where it was unimaginable just a decade ago. Drought-resistant varieties of corn are also making the periphery High Plains region of Kansas and Western portions of Nebraska and the Dakotas viable corn producers.

In an average year, the U.S. will produce 15 billion bushels of corn5. Ethanol production consumes 5 billion bushels of corn annually,6 and 6.8 billion bushels will be directed to the food, seed, and industrial sectors.7 The remainder is used as feed or transported to the export market. Significant corn importing countries are Mexico, Canada, China, Japan, and Korea.7 The by-product of the ethanol production process, dried distiller’s grains (DDG), has a high protein content and is also a key export item for feed usage in these countries.
Corn is the gold standard in feeding programs
Corn is typically the main feed ingredient in finishing diets for beef, pork, and poultry producers. It is also a key ingredient in dairy rations and used in growing diets for younger livestock. In addition to being fed as grain, corn silage is a wonderful feedstuff that is widely used in cattle diets. Yes, other ingredients are part of the rations, such as soybean meal, hay, and various by-product feedstuffs (which include wet and dry distiller grain), but corn is the key. At times, due to economics and availability, wheat or milo may be substituted for corn, but only for a minimal amount of time.
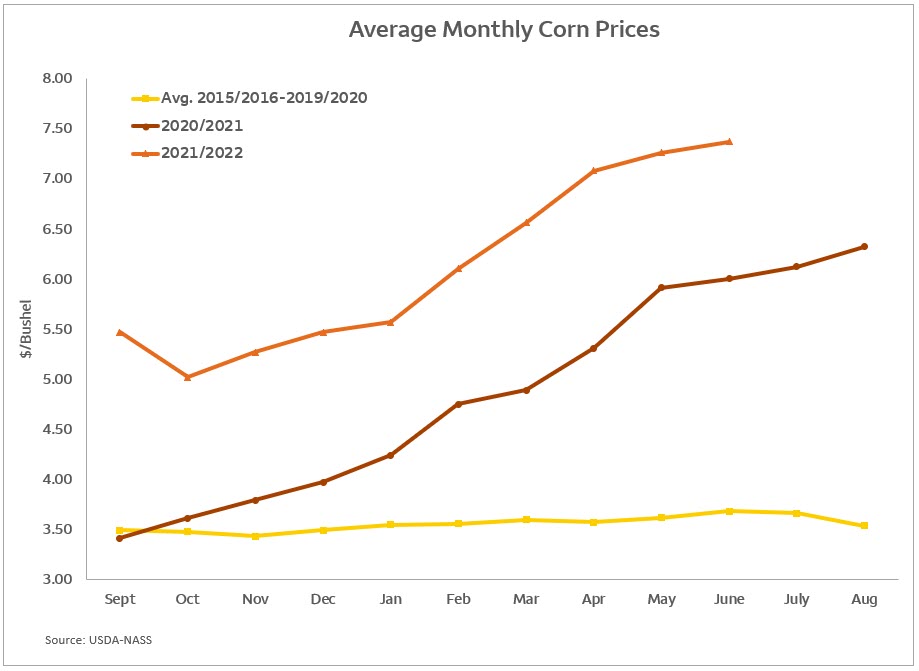
Grain prices are up substantially this year compared to the past ten years, and there is a great amount of price volatility as well.8 The higher price is negatively affecting margins for livestock, dairy, and poultry producers since the higher ration prices means it costs more to put on a pound of gain, and more to produce a gallon of milk, etc.
According to data from K-State Research and Extension “Focus on Feedlots”, the average cost of gain for a feedlot steer in the commercial feedlots in May 2021 was $.9882/lb. of weight gained, with the range of corn prices at $6.08-$7.00/bu. In May 2022, average steer cost of gain was $1.1795/lb. with the range of corn prices at $7.94-$8.59/bu., representing an increase of 19.4% in the cost to add one pound of gain.9 To be fair, not all the price increases are due to higher corn prices since hay and other ingredient prices are also up.
The local basis is also having a significant impact on the price of corn. Take for example a corn-deficit area such as the Texas Panhandle with high demand from the feedlots. Much of the required corn must be railed or trucked in from the Midwest, so the basis has been much higher than in past years, and results in a higher corn price. Compare this example to the eastern Dakotas, an area of corn excess, where the crop must be moved out since the local demand cannot utilize all that is produced. The basis in the eastern Dakotas is less positive, or may well be negative, resulting in a lower corn price.
Current Situation
The 2022 U.S. corn crop harvest began in July in South Texas and will slowly advance northward until late fall when the northern states pick their corn. Thus far, the prices have been highly volatile as the world supply has been hindered by the Ukraine/Russia conflict, along with drought, and COVID-related supply chain issues. Also, uncertainty over railcar, truck, and container availability remains a concern. The same is true of labor and fertilizer supply. Corn prices this year have been at historical highs and have gyrated with each rain and hint of cease fire in Ukraine.4 And, trading on the Chicago Board of Trade has occurred at a high volume since price volatility always attracts speculators.
The bottom line is that the world needs a good U.S. corn crop to sustain the food chain. The stocks-to-use ratio is the key metric since it illustrates the quantity of available corn relative to how much will be used annually. Currently, this metric is extremely low having moved below 10%;8 thus, corn prices will likely remain at elevated levels throughout the next marketing year.9 However, so will price volatility.
1Statista – (statista.com)
2World Corn Production by Country – AtlasBig.com
3USDA ERS – Wheat Sector at a Glance (www.ers.usda.gov)
4USDA NASS – (nass.usda.gov) Corn: Yield by year, Soybeans Yield by year
5Abbott, C. 2021- “USDA: Strong U.S. economy but falling crop prices in 2022” Successful Farming (agriculture.com/news/business)
6Schill Rekta, S. 2013. “Ethanol Producer Magazine – The Latest News and Data About Ethanol Production.” Ethanol Producer Magazine. (ethanolproducer.com/blog)
7USDA Supply and Demand data
8FRED Economic data –(fred.stlouisfed.org) Producer Price Index by Commodity: Farm Products: Corn
9CME Group (cmegroup.com), Corn Reports

Tim Luginsland is a Sector Manager within Wells Fargo’s Food and Agribusiness Industry Advisor group focused on the Dairy, Grain, and Oil Seed sectors. He has served in this role since 2000 and interfaces with dairy processors, grain merchants, milling companies, renewable fuel manufacturers, and exporters. Prior to joining Wells Fargo, Tim held various professional positions within the agricultural industry within the areas of farm management, milling and finance.
Tim was raised on a diversified farm in Central Kansas. He has a Bachelor of Science degree from Kansas State University, and a Master of Science degree from the University of Arizona; both in agricultural economics.

Russ Heskett is an Agribusiness Advisor in the Wells Fargo’s Agribusiness Services Advisors group and has a primary focus on the cattle sector with secondary focus on other livestock and row crops. Russ joined Well Fargo and the Agribusiness Industry Advisor Group in 2001. Prior, he worked as a sales representative in the animal health industry and before that served as an ag advisor with another financial institution.
Russ grew up on a farm in central Nebraska and graduated from the University of Nebraska-Lincoln in 1983 with a B.S. degree in Animal Science.
